| NOK mill. |
2012 |
2011 |
2010 |
2009 |
2008 |
| |
|
|
|
|
|
| Solidity |
|
|
|
|
|
| Ferds total value-adjusted equity |
19 600 |
16 100 |
17 000 |
15 000 |
11 500 |
| Equity ratio (%) value-adjusted |
91% |
89% |
92% |
99% |
100% |
| |
|
|
|
|
|
| Liquidity |
|
|
|
|
|
| Cash, listed securities and equity funds |
5 161 |
4 528 |
6 269 |
4 616 |
3 906 |
| |
|
|
|
|
|
| Return on capital |
|
|
|
|
|
| Return on equity (%) value-adjusted |
23% |
- 4% |
15% |
27% |
- 30% |
| |
|
|
|
|
|
Ferd AS company accounts
|
|
|
|
|
|
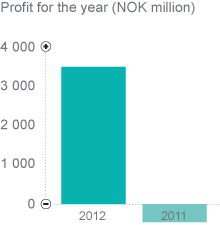
| Profit and loss account |
|
|
|
|
|
| Operating revenue |
3 937 |
-281 |
|
|
|
| Operating profit |
3 740 |
-459 |
|
|
|
| Profit for the year |
3 629 |
-380 |
|
|
|
| Effective tax rate |
1,0% |
1,8% |
|
|
|
| |
|
|
|
|
|
| Cash Flow |
|
|
|
|
|
| Net cash flow from operations |
- 203 |
668 |
|
|
|
| Net cash flow from investments |
- 855 |
- 1 448 |
|
|
|